Stock Evaluation
FREE DOWNLOAD
Evaluate and monitor your stock, using this flexible FREE excel template made by QuickWinsLab and FreeExcelTemplates. This excel template is suitable for monitoring and evaluating stock and rotation of products.
The evaluation of the stock is based on FIFO, therefore different purchase prices for the same product is supported and reflected to stock evaluation.
Just enter the products list, purchases and sales by date and you will have a useful insight on the value of your stock, the coverage and the rotation of your products
What you will get
- One FREE excel template with sample data, to see how stock evaluation template works
- One FREE blank excel template, to populate your data from scratch
Requirements and important features
This professional but yet FREE excel template works with excel for Microsoft 365. If you do not have a subscription then you are strongly advised to do so, as otherwise you will be missing a lot of new functionalities and risk the template not to work.
The template contains NO VBA, NO MACROs, only Pivot Tables, PowerQuery and Data Model (Power Pivot).
Description
This template is suitable for monitoring and evaluating stock and rotation of products. What does it do?Evaluates the stock based on FIFO, therefore different purchase prices for the same product are supported and are reflected to stock evaluation. Just enter the products list, purchases and sales by date and you will have a useful insight on the value of your stock, the coverage and the rotation of your products, through eye-catching charts and dashboard.
Main features
- Products list
- Setting of stock coverage in days threshold for low stock or slow-moving products
- Setting of a threshold of % of value of slow moving products above which the stock is of bad quality
- Record purchases and sales aggregated by date and SKU, including prices
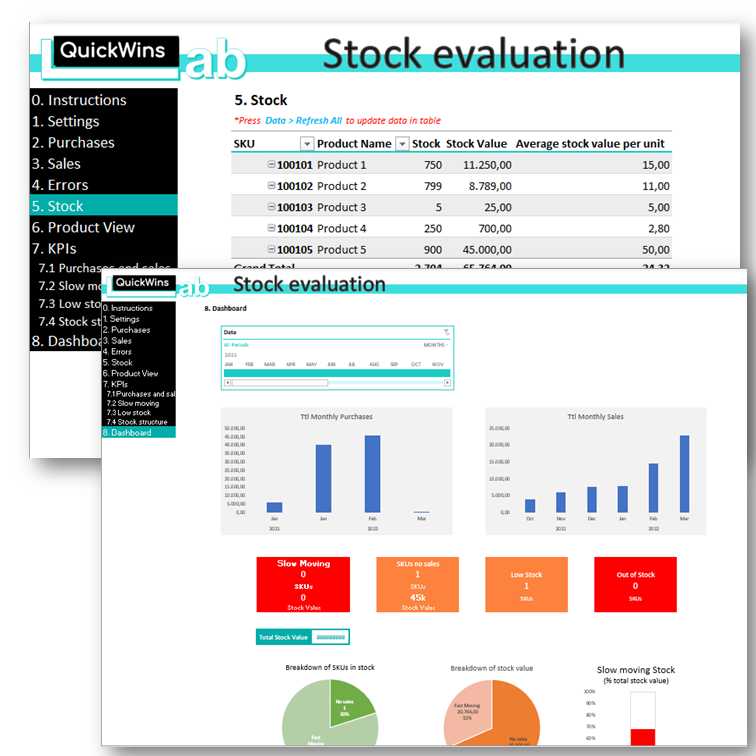
- Full stock report (inventory): units, Stock value, average unit price per SKU
- Product view with history of purchases and sales (tables and charts) and evolution of prices
- KPIs including slow moving (slow rotation) SKUs, SKUs without sales, low stock and out-of-stock SKUs and stock structure (fast/slow moving in terms of stock units and value)
- Dashboard with main charts and cards
View it in action
Instructions
The first sheet of the template includes instructions on how to work with it.
Other info
- The template is unlocked. Some worksheets may be protected, so as to avoid random unwanted modifications in cells, but you may unprotect them at any time - no password needed.
- Built for Excel for Microsoft 365
- The template has the look and feel of a non-excel application (hidden sheet tabs, hidden headers and gridlines). You may unhide all above following the instructions included in the first page (sheet) of the template.
- You are advised to always keep a backup of the blank template, in order to re-use it or in case of mistakenly breaking the working template - Just put your raw data (without the calculated fields) to a copy of the blank template and you are ready!
This template may not be distributed or sold, published to an online gallery or hosted on a website or server in a way that makes it available to the general public